Following the kernel #4 – MLO part 1

Following the kernel #4 – MLO part 1

We have finished last period on jumping into reset vector of the MLO code. If you haven’t done it yet, I encourage you to clone U-Boot repository from GitHub https://github.com/u-boot/u-boot. I’m working on the newest master commit a6ba59583abd4085db5ab00358d751f175e2a451. As I wrote, U-Boot is configured via KBuild with default am335x set.

Reset vectors of MLO are defined in common for U-Boot and MLO (TPL and SPL) place – arch/arm/lib/vectors.S file. If you were careful enough, your debugger should stop on the line 87:

/*
 *************************************************************************
 *
 * Exception vectors as described in ARM reference manuals
 *
 * Uses indirect branch to allow reaching handlers anywhere in memory.
 *
 *************************************************************************
 */

_start:
#ifdef CONFIG_SYS_DV_NOR_BOOT_CFG
	.word	CONFIG_SYS_DV_NOR_BOOT_CFG
#endif
	ARM_VECTORS // <--- right here
#endif /* !defined(CONFIG_ENABLE_ARM_SOC_BOOT0_HOOK) */

ARM_VECTORS is the macro defined few lines above (21-34).

/*
 * A macro to allow insertion of an ARM exception vector either
 * for the non-boot0 case or by a boot0-header.
 */
        .macro ARM_VECTORS
#ifdef CONFIG_ARCH_K3
	ldr     pc, _reset
#else
	b	reset
#endif
	ldr	pc, _undefined_instruction
	ldr	pc, _software_interrupt
	ldr	pc, _prefetch_abort
	ldr	pc, _data_abort
	ldr	pc, _not_used
	ldr	pc, _irq
	ldr	pc, _fiq
	.endm

Our architecture is OMAP2+ (CONFIG_ARCH_OMAP2PLUS – check it with make menuconfig for practice), so our code includes b reset part, and this is the instruction placed under our first breakpoint. We are jumping into the reset routine. This one is defined in arch/arm/cpu/armv7/start.S file. Reset routine starts in line 38.

reset:
	/* Allow the board to save important registers */
	b	save_boot_params
save_boot_params_ret:
#ifdef CONFIG_ARMV7_LPAE
/*
 * check for Hypervisor support
 */
	mrc	p15, 0, r0, c0, c1, 1		@ read ID_PFR1
	and	r0, r0, #CPUID_ARM_VIRT_MASK	@ mask virtualization bits
	cmp	r0, #(1 << CPUID_ARM_VIRT_SHIFT)
	beq	switch_to_hypervisor
switch_to_hypervisor_ret:
#endif
	/*
	 * disable interrupts (FIQ and IRQ), also set the cpu to SVC32 mode,
	 * except if in HYP mode already
	 */
	mrs	r0, cpsr
	and	r1, r0, #0x1f		@ mask mode bits
	teq	r1, #0x1a		@ test for HYP mode
	bicne	r0, r0, #0x1f		@ clear all mode bits
	orrne	r0, r0, #0x13		@ set SVC mode
	orr	r0, r0, #0xc0		@ disable FIQ and IRQ
	msr	cpsr,r0

/*
 * Setup vector:
 * (OMAP4 spl TEXT_BASE is not 32 byte aligned.
 * Continue to use ROM code vector only in OMAP4 spl)
 */
#if !(defined(CONFIG_OMAP44XX) && defined(CONFIG_SPL_BUILD))
	/* Set V=0 in CP15 SCTLR register - for VBAR to point to vector */
	mrc	p15, 0, r0, c1, c0, 0	@ Read CP15 SCTLR Register
	bic	r0, #CR_V		@ V = 0
	mcr	p15, 0, r0, c1, c0, 0	@ Write CP15 SCTLR Register

#ifdef CONFIG_HAS_VBAR
	/* Set vector address in CP15 VBAR register */
	ldr	r0, =_start
	mcr	p15, 0, r0, c12, c0, 0	@Set VBAR
#endif
#endif

	/* the mask ROM code should have PLL and others stable */
#ifndef CONFIG_SKIP_LOWLEVEL_INIT
#ifdef CONFIG_CPU_V7A
	bl	cpu_init_cp15
#endif
#ifndef CONFIG_SKIP_LOWLEVEL_INIT_ONLY
	bl	cpu_init_crit
#endif
#endif

	bl	_main

As we can see, here we have more code to focus on. This code prepares CPU before execution and call _main function at last stage. First thing is jumping into save_boot_params routine. This one is defined in arch/arm/mach-omap2/lowlevel_init.S.

ENTRY(save_boot_params)
	ldr	r1, =OMAP_SRAM_SCRATCH_BOOT_PARAMS
	str	r0, [r1]
	b	save_boot_params_ret
ENDPROC(save_boot_params)

Do you remember part 1 of this series? One of the last thing done by the ROM Code is passing boot device information via pointer passed to r0 register, just before running MLO. As we can see, this pointer is stored under OMAP_SRAM_SCRATCH_BOOT_PARAMS address. r0 for sure will be utilized later, so this is the first thing done. After that, flow is going back to rest of reset.

CONFIG_ARMV7_LPAE is turned off, so we are going to line 56. The Current Program State Register is set. If processor is in Hypervisor Mode it is left unchanged, otherwise Supervisor mode is set. After that all interrupts are masked with that register, no matter which mode is running. Supervisor mode (SVC) is state of processor proper for running kernel mode, this is worth noting. If you want to learn more about ARM processor modes, examine Reference Manual of ARMv7 architecture.

Right after that more sophisticated things are done. MCR and MRC instructions are used. These are instructions communicating with coprocessors attached on the silicon. There are maximum 16 coprocessors – p15 is so called Control Processor , described here https://developer.arm.com/documentation/ddi0360/e/control-coprocessor-cp15/about-control-coprocessor-cp15?lang=en. Instruction mnemonics supported by it are extensively described here https://developer.arm.com/documentation/ddi0360/e/control-coprocessor-cp15/summary-of-cp15-instructions. These sites refer to not our architecture – some things might be not the same as in our chip, but they are well explained.

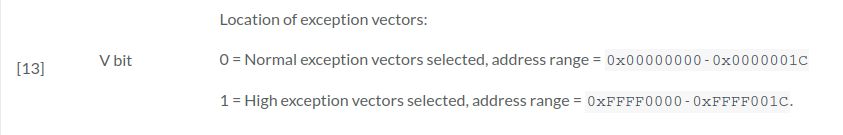
As you could read in above links, first instruction mrc p15, 0, r0, c1, c0, 0 loads current value of MMU-related Control Register into local, core register r0. Then program clears V-bit (with bic instruction), which means, that exception vectors are kept in 0x00000000 address range and write it back to the Control Register with mcr.

Next instruction mcr p15, 0, r0, c12, c0, 0 sets the Vector Base Address Register inside Control Processor to the address of _start. This symbol was defined in our first listing in this article. Now all the exceptions caught by processor should be handled by the Vector defined in MLO (described in vector.s).

Before we jump to the long-awaited C code there are couple of assembly routines which must be executed. The first one is cpu_init_cp15. This one is defined in file arch/arm/cpu/armv7/start.S, line 143. As you can see, there are a lot of MCR transfers, I will try to explain general idea behind the whole procedure without analyzing every single mnemonic.

The name of routine tells us, that once again coprocessor number 15 will be initialized. As the comments says line 143-148 invalidates all data saved in L1 cache, which after restart may have wrong values. These are TLBs (Translation Lookaside Buffers – records which speed up resolving virtual address into physical memory), instruction caches which might buffer adjacent blocks of assembly code, to speed up instruction fetches, and lastly invalidation of BP (Branch Prediction) arrays is done. Branch prediction is another mechanism of speeding up pipeline processors to fetch the right instruction, even if it is not the next mnemonic of our assembly code. If you want learn more in this area, I encourage to read wiki article https://en.wikipedia.org/wiki/Branch_predictor.

After invalidating caches, Data Synchronization Barrier is done to explicitly wait for the end of all memory operations, and ISB (Instruction Synchronization Barrier), described in documentation as flushing prefetch buffer is done. As documentation says:

The Flush Prefetch Buffer instruction flushes the pipeline in the processor, so that all instructions following the pipeline flush are fetched from memory, (including the instruction cache), after the instruction has been completed. Combined with Data Synchronization Barrier, and potentially a memory barrier, this ensures that any instructions written by the processor are executed. This guarantee is required as part of the mechanism for handling self-modifying code. The execution of a Data Synchronization Barrier instruction and the invalidation of the Instruction Cache and Branch Target Cache are also required for the handling of self-modifying code. The Flush Prefetch Buffer is guaranteed to perform this function, while alternative methods of performing the same task, such as a branch instruction, can be optimized in the hardware to avoid the pipeline flush (for example, by using a branch predictor).

Next bunch of assembly is commented as disabling MMU stuff and caches. Once again c1,c0 operation (Read Control Register) is made, than V-bit (once again), and CAM bits are cleared. Then A (bit 1) and Z (bit 11) are set. V-bit was described, previously. I don’t know why it’s repeated. CAM bits (https://developer.arm.com/documentation/ddi0360/e/control-coprocessor-cp15/register-descriptions/c1–control-register?lang=en) disables data Cache, Alignment fault checking and MMU. According to the hash-defines, we can turn on or turn off instruction cache in this place. In our configuration it is turned on, so setting bit with orr instruction is made.

After that, bunch of Errata stuff is done. Fortunately, none of these are applied in our build beside CONFIG_ARM_CORTEX_A8_CVE_2017_5715. But before that more interesting operations are done

	mov	r5, lr			@ Store my Caller
	mrc	p15, 0, r1, c0, c0, 0	@ r1 has Read Main ID Register (MIDR)
	mov	r3, r1, lsr #20		@ get variant field
	and	r3, r3, #0xf		@ r3 has CPU variant
	and	r4, r1, #0xf		@ r4 has CPU revision
	mov	r2, r3, lsl #4		@ shift variant field for combined value
	orr	r2, r4, r2		@ r2 has combined CPU variant + revision

/* Early stack for ERRATA that needs into call C code */
#if defined(CONFIG_SPL_BUILD) && defined(CONFIG_SPL_STACK)
	ldr	r0, =(CONFIG_SPL_STACK)
#else
	ldr	r0, =(CONFIG_SYS_INIT_SP_ADDR)
#endif
	bic	r0, r0, #7	/* 8-byte alignment for ABI compliance */
	mov	sp, r0

Once again CP15 is used to read our silicon ID. CPU variant and revision is combined and stored in r2 register. After that, according to configuration stack pointer address is chosen – in our case it is 0x4030ff10 (the value of CONFIG_SYS_INIT_SP_ADDR). Check this address in part #1 of my series. You will find out, that it’s one of the highest accessible address on Internal SRAM memory. This address is aligned to 8-bytes with clearing 3 least significant bits. Finally stack pointer is initialized with movopcode. Wohoo! Doing it is last thing prepared by cpu_init_cp15 routine, so we are going back to the reset routine and jump to another place, called cpu_init_crit.

ENTRY(cpu_init_crit)
	/*
	 * Jump to board specific initialization...
	 * The Mask ROM will have already initialized
	 * basic memory. Go here to bump up clock rate and handle
	 * wake up conditions.
	 */
	b	lowlevel_init		@ go setup pll,mux,memory
ENDPROC(cpu_init_crit)

It is the place, where more specialized initialization might be done. Our lowlevel_init procedure is implemented in arch/arm/cpu/armv7/lowlevel_init.S

WEAK(s_init)
	bx	lr
ENDPROC(s_init)
.popsection

.pushsection .text.lowlevel_init, "ax"
WEAK(lowlevel_init)
	/*
	 * Setup a temporary stack. Global data is not available yet.
	 */
#if defined(CONFIG_SPL_BUILD) && defined(CONFIG_SPL_STACK)
	ldr	sp, =CONFIG_SPL_STACK
#else
	ldr	sp, =CONFIG_SYS_INIT_SP_ADDR
#endif
	bic	sp, sp, #7 /* 8-byte alignment for ABI compliance */
#ifdef CONFIG_SPL_DM
	mov	r9, #0
#else
	/*
	 * Set up global data for boards that still need it. This will be
	 * removed soon.
	 */
#ifdef CONFIG_SPL_BUILD
	ldr	r9, =gdata
#else
	sub	sp, sp, #GD_SIZE
	bic	sp, sp, #7
	mov	r9, sp
#endif
#endif
	/*
	 * Save the old lr(passed in ip) and the current lr to stack
	 */
	push	{ip, lr}

	/*
	 * Call the very early init function. This should do only the
	 * absolute bare minimum to get started. It should not:
	 *
	 * - set up DRAM
	 * - use global_data
	 * - clear BSS
	 * - try to start a console
	 *
	 * For boards with SPL this should be empty since SPL can do all of
	 * this init in the SPL board_init_f() function which is called
	 * immediately after this.
	 */
	bl	s_init
	pop	{ip, pc}
ENDPROC(lowlevel_init)

arch/armv7 directory contains generic implementation of low-level init. All routines are defined as so-called weak symbols. If linker will find other with the same name, it will leave weak symbol not used and choose the other. Basically it doesn’t implement nothing new. Once again stack pointer is initialized. CONFIG_SPL_DM is defined (Driver Model for SPL), so r9 is zeroed.

Our program stack is ready, so we can use it with a pushinstruction. Link-register and instruction pointer is passed, after that branch with copying return address to link-register is done. We are jumping to s_init, but as we can see in the listing, it is empty.

Finally after returing to resetroutine, we are jumping to the _main routine, which is really, really close to the C-world. It is defined in arch/arm/lib/crt0.S. As we can see, it is the code initializing C environment (clearing BSS, preparing heap etc. We will cover it in the next part of the series.

Another strace useful option

This article will be really quick. I found another useful strace option. It allows to track system calls related to specified path -P. It is part of strace utility, so we can assume, it will be much more efficient than grepping the output.

As an example I can show you tracing all data sent by communication program to another device connected via RS-485 (/dev/ttyO4)

# strace -p 313 -x -e trace=write,read -P /dev/ttyO4
Process 313 attached
read(6, "\xff\xff\x01\x03\xd0\x07\x00\x00\xab\x01", 256) = 10
read(6, "\x00\x00\xb6\x01\x00\x00\x9e\x01\x00\x00\x00\x00\x00\x00\x00\x00\x00\x00\x00\x00\x10", 256) = 21
read(6, "\x07\x10\x00\x00\x00\x00\x00\x3b\x99\xff\x02", 256) = 11
write(6, "\xff\x01\x01\x06\x07\x00\x00\x00\x00\x00\x00\x00\x00\x00\x00\x00\x00\x00\x00\x00\x00\x00\x00\x00\x00\x00\x00\x00\x00\xeb\xf0\xff"..., 33) = 33
read(6, "\xff\xff\x01\x01\xd0\x07\x00\x00", 256) = 8
read(6, "\x9d\x01\x00\x00\xa6\x01\x00\x00\x90\x01\x00\x00\x00", 256) = 13
read(6, "\x00\x00\x00\x00\x00\x00\x00\x00\x00\x00\x07\x00", 256) = 12
read(6, "\x00\x00\x00\x00\x00\x11\x41\xff\x02", 256) = 9
write(6, "\xff\x01\x02\x06\x07\x00\x00\x00\x00\x00\x00\x00\x00\x00\x00\x00\x00\x00\x00\x00\x00\x00\x00\x00\x00\x00\x00\x00\x00\x33\x06\xff"..., 33) = 33
read(6, "\xff\xff\x01\x02\xd0\x07", 256) = 6

Program works on PID 313 (-p 313), we want to show data in hexadecimal form (-x) and trace only write and read syscalls (-e trace=write,read). Finally the option specifying the right path is -P /dev/ttyO4. As we can see, only file descriptor 6. To proof that it’s the right one, let’s list all file descriptors used by the process:

# ls -la /proc/313/fd
total 0
dr-x------    2 root     root             0 Nov  8 08:03 .
dr-xr-xr-x    8 root     root             0 Nov  8 08:03 ..
lr-x------    1 root     root            64 Nov  8 08:03 0 -> /dev/null
l-wx------    1 root     root            64 Nov  8 08:03 1 -> /dev/null
l-wx------    1 root     root            64 Nov  8 08:03 2 -> /dev/null
lrwx------    1 root     root            64 Nov  8 08:03 3 -> socket:[8861]
lrwx------    1 root     root            64 Nov  8 08:03 4 -> anon_inode:[timerfd]
lrwx------    1 root     root            64 Nov  8 08:03 5 -> anon_inode:[timerfd]
lrwx------    1 root     root            64 Nov  8 08:04 6 -> /dev/ttyO4
lrwx------    1 root     root            64 Nov  8 08:04 7 -> /dev/pts/0

File descriptor number 6 is linked to our resource – /dev/ttyO4. This option is very useful in solving wide range of problems. Hope it will help.

C, C++, Linux

Valgrind on ARM

If you have a problem with memory bloating or leaks, the tool of the first choice is Valgrind. Briefly, it wraps some standard library calls with their implementation (malloc, new, etc.) and tracks all memory allocation within your code. By default, Valgrind is checking whether all memory allocated in the program is freed at the end. A more sophisticated tool is massif – it collects all allocations to profile memory consumption over time. After the program run, you may check it with ms_print or massif-visualizer GUI.

During my last job, I’ve noticed, that my application’s memory is constantly increasing. I’ve run Valgrind massif to check why. Unfortunately, I couldn’t find the reason, since all stacks were empty. All I could see was the amount of memory consumed without stack traces. Listing below shows the ms_print output

    KB
556.3^                                                                       #
     |                                                                    @@@#
     |                                                                @@@@@@@#
     |                                                           @@@@@@@@@@@@#
     |                                                       @@@@@@@@@@@@@@@@#
     |                                                    @@@@@@@@@@@@@@@@@@@#
     |                                                 @@:@@@@@@@@@@@@@@@@@@@#
     |                                             :@::@ :@@@@@@@@@@@@@@@@@@@#
     |                                       @@:::::@: @ :@@@@@@@@@@@@@@@@@@@#
     |                                   @@@@@@: :::@: @ :@@@@@@@@@@@@@@@@@@@#
     |                              @@@@@@@@@@@: :::@: @ :@@@@@@@@@@@@@@@@@@@#
     |                           @@@@@@ @@@@@@@: :::@: @ :@@@@@@@@@@@@@@@@@@@#
     |                         ::@@@@@@ @@@@@@@: :::@: @ :@@@@@@@@@@@@@@@@@@@#
     |                  @  ::::::@@@@@@ @@@@@@@: :::@: @ :@@@@@@@@@@@@@@@@@@@#
     |                ::@::::: ::@@@@@@ @@@@@@@: :::@: @ :@@@@@@@@@@@@@@@@@@@#
     |             :::::@: ::: ::@@@@@@ @@@@@@@: :::@: @ :@@@@@@@@@@@@@@@@@@@#
     |     @@@@:::::::::@: ::: ::@@@@@@ @@@@@@@: :::@: @ :@@@@@@@@@@@@@@@@@@@#
     |  :::@ @ ::: :::::@: ::: ::@@@@@@ @@@@@@@: :::@: @ :@@@@@@@@@@@@@@@@@@@#
     | :: :@ @ ::: :::::@: ::: ::@@@@@@ @@@@@@@: :::@: @ :@@@@@@@@@@@@@@@@@@@#
     | :: :@ @ ::: :::::@: ::: ::@@@@@@ @@@@@@@: :::@: @ :@@@@@@@@@@@@@@@@@@@#
   0 +----------------------------------------------------------------------->Gi
     0                                                                   1.908

Number of snapshots: 88
 Detailed snapshots: [4, 5, 6, 15, 22, 23, 24, 25, 26, 27, 28, 29, 30, 31, 32, 33, 34, 35, 40, 43, 45, 46, 47, 48, 49, 51, 53, 55, 57, 59, 61, 63, 65, 67, 69, 71, 73, 75, 77, 79, 81, 83, 85, 87 (peak)]

--------------------------------------------------------------------------------
  n        time(i)         total(B)   useful-heap(B) extra-heap(B)    stacks(B)
--------------------------------------------------------------------------------
  0              0                0                0             0            0
  1     46,537,185           69,888           60,082         9,806            0
  2     80,589,950           98,024           85,567        12,457            0
  3    122,171,391           89,984           74,107        15,877            0
  4    167,353,809          119,272           99,911        19,361            0
83.77% (99,911B) (heap allocation functions) malloc/new/new[], --alloc-fns, etc.

--------------------------------------------------------------------------------
  n        time(i)         total(B)   useful-heap(B) extra-heap(B)    stacks(B)
--------------------------------------------------------------------------------
  5    199,890,853          127,048          105,155        21,893            0
82.77% (105,155B) (heap allocation functions) malloc/new/new[], --alloc-fns, etc.

--------------------------------------------------------------------------------
  n        time(i)         total(B)   useful-heap(B) extra-heap(B)    stacks(B)
--------------------------------------------------------------------------------
  6    221,582,101          132,288          108,651        23,637            0
82.13% (108,651B) (heap allocation functions) malloc/new/new[], --alloc-fns, etc.

As you can see, there are no stacks collected. I spent two days investigating what’s going on. I will not write about the whole process, but I have eliminated the most obvious tracks like debug symbols, compiler options, etc. The last thing was reading the docs. I found these options:


       --unw-stack-scan-thresh=<number> [default: 0] ,
       --unw-stack-scan-frames=<number> [default: 5]
           Stack-scanning support is available only on ARM targets.

           These flags enable and control stack unwinding by stack
           scanning. When the normal stack unwinding mechanisms -- usage
           of Dwarf CFI records, and frame-pointer following -- fail,
           stack scanning may be able to recover a stack trace.

           Note that stack scanning is an imprecise, heuristic mechanism
           that may give very misleading results, or none at all. It
           should be used only in emergencies, when normal unwinding
           fails, and it is important to nevertheless have stack traces.

           Stack scanning is a simple technique: the unwinder reads
           words from the stack, and tries to guess which of them might
           be return addresses, by checking to see if they point just
           after ARM or Thumb call instructions. If so, the word is
           added to the backtrace.

           The main danger occurs when a function call returns, leaving
           its return address exposed, and a new function is called, but
           the new function does not overwrite the old address. The
           result of this is that the backtrace may contain entries for
           functions which have already returned, and so be very
           confusing.

           A second limitation of this implementation is that it will
           scan only the page (4KB, normally) containing the starting
           stack pointer. If the stack frames are large, this may result
           in only a few (or not even any) being present in the trace.
           Also, if you are unlucky and have an initial stack pointer
           near the end of its containing page, the scan may miss all
           interesting frames.

           By default stack scanning is disabled. The normal use case is
           to ask for it when a stack trace would otherwise be very
           short. So, to enable it, use --unw-stack-scan-thresh=number.
           This requests Valgrind to try using stack scanning to
           "extend" stack traces which contain fewer than number frames.

           If stack scanning does take place, it will only generate at
           most the number of frames specified by
           --unw-stack-scan-frames. Typically, stack scanning generates
           so many garbage entries that this value is set to a low value
           (5) by default. In no case will a stack trace larger than the

I’ve set --unw-stack-scan-thresh to 5, because all stacks had 0 or 1 element. --unw-stack-scan-frames to 30 – I don’t use recursion, so this value is much above needs. After setting it up the stacks appeared in ms_print output. Apparently, normal stack resolving failed – why? Maybe it’s because old gcc – 4.9.2 version. Another possible reason is that the standard stack parser works only on x86 architecture.

I didn’t spend much time finding out why this option was needed. If you know why, please share your thoughts in a comment.

C++

Overload operators wisely – proxy class pattern

One of the key features of C++ is operator overloading. Beginners might find it difficult since the syntax is not intuitive. In this article, I will show you how to omit typical problems in this case.

In my last project, I had to operate on large XML files – read and write some values under specific XPath locations. during development, I have used libxml2 library. It has a really complicated C-based interface, so I had to create a convenience wrapper class.

I used C++ so I decided to use the index operator to fetch values under a specific key. The first interface looked like the following:

class XmlWrapper
{
public :
   //...
   std::string operator[](const std::string &key) const; //getter
   std::string& operator[](const std::string &key); //setter
   //...
};

What is wrong with this approach? At the first sight, it might look ok, but if you start implementation of setter, you will find out, that changing the content of the in-memory libxml2 tree is impossible. The upper approach would be ok if we would change the class attribute of type std::stringdsdf. Otherwise, this approach fails.

What is the possible solution to this approach? I used a proxy class design pattern. Before I will show you the code I will write down, what were the goals of the solution.

  1. Access in-memory XML tree with setter to modify its content
  2. Assign results of getter bracket operator to the std::string variable without intermediate steps.
  3. Like point 2, but the other way assign to setter type std::string.

To implement goal 1, we must have some connection with XML-tree. String class obviously doesn’t. So the returned proxy class has the reference to XmlWrapper holding libxml2 instrumentation. To implement goal 2 we will implement cast operator from proxy class to std::string. To implement goal 3, we will do a similar thing – overload operator = with std::string parameter. The solution looks like this:

class ProxyXml; //forward declaration
class XmlWrapper
{
public :
   //...
   const ProxyXml operator[](const std::string &key) const; //getter
   ProxyXml operator[](const std::string &key); //setter
   //...
};
class ProxyXml
{
   //...
   operator std::string() const;
   ProxyXml& operator=(const std::string &s);
protected :
   XmlWrapper &xml_;
};

If we want to access XML content for read, the code creates a temporary ProxyXml object, and convert it to std::string class. If we want to modify XML content we create ProxyXml and use its XmlWrapper reference inside operator=. Sample usage looks like this:

int main(int argc, const char *argv[])
{
   XmlWrapper xml("path/to/file.xml");
   std::string somevalue = xml["keytosomevalue"]; //getter
   somevalue.append("appendedtext");
   xml["keytosomevalue"] = somevalue; // setter with updated content
   return 0;
}

Following the Kernel #3 – Debugging environment

In this part, I will show you how to configure your debug environment to start following the kernel on BeagleBone Black board. My laptop uses Ubuntu 18.04 LTS distribution. As the debugging interface, I will use the JLink device, connected with BBB Compact TI JTAG via an adapter prepared by myself (link to the project below). The connector is placed in the bottom of the BBB and is normally not soldered. Things, which are needed (except JLink and our BeagleBone Black) are listed below.

OpenOCD

The most important software part gdbserver, controlling the JLink device. Like almost everything in this series, I will use open-sourced OpenOCD, which you can download from the git repository and install locally:

$ git clone git://git.code.sf.net/p/openocd/code openocd
$ cd openocd
$ ./bootstrap # only if you cloned git repo (like me)
$ mkdir install # local install directory (we don't want to polute system)
$ ./configure --prefix=`pwd`/install --enable-jlink
$ make && make install

Probably you will need to install some missing dependencies. OpenOCD README says about these:

- make
- libtool
- pkg-config >= 0.23 (or compatible)
- autoconf >= 2.64
- automake >= 1.14
- texinfo >= 5.0
U-Boot

The next thing is building our MLO image, which is a part of the U-Boot repository. I assume, that you have arm-linux-gnueabihf- toolchain after reading the previous part and you know how to use it with Kbuild. So just do the following:

$ git clone https://github.com/u-boot/u-boot.git
$ cd u-boot
$ export ARCH=arm
$ export CROSS_COMPILE=arm-linux-gnueabihf- # should be in PATH
$ make am335x_defconfig # like omap2plus_defconfig previously
$ make

After building it MLO binary should be placed in the root folder. The ELF file (needed to debug) is placed in the spl subfolder.

SD Card

I described the early boot process in the first part of this series. We end up searching for a file called MLO in the FAT16 partition. We have to prepare it, and after building U-Boot we have all we need.

Enter the SD card to the slot. It should be detected as /dev/mmcblkX device. In my case, it is /dev/mmcblk0. After that run these commands:

$ sudo dd if=/dev/zero of=/dev/mmcblk0 bs=512 # not mandatory - clear card
$ echo -e "2048,98304,0x0E,*\n" | sudo sfdisk /dev/mmcblk0 # create MBR entry with offset 2048, size 98304, type 0x0E (FAT16), marked to boot (*)
$ sudo mkfs.vfat /dev/mmcblk0p1 # Prepare file system
$ sudo mount /dev/mmcblk0p1 /mnt
$ sudo cp MLO /mnt/ 

sfdisk is a utility similar to fdisk. Of course, you can use a more interactive fdisk and pass similar parameters. The most important is choosing the right file system and marking it to boot.

Remember that the SD card slot is the second device examined during the boot process. If you are not sure if eMMC is empty, press the S2 button during start. If your eMMC is not empty, run Linux on it and clear mmcblk0 device like on the upper listing (remember it will remove all your data from BeagleBone :-)).

cTI JTAG adapter

Unfortunately, BeagleBone Black has no port, matching the JLink device. However, it is pretty easy to adapt the existing Compact TI JTAG connector and connect it with an adapter, or simple wiring. Here you can find my Kicad adapter project – https://github.com/rafalo235/jlink-cti-adapter.

If you don’t want to make it on your own with, for example with toner transfer technique. You can order it from a PCB manufacturer, or simply wire it together according to the schematics.

Run

If you are done (JLink connected to the adapter, SD card in a slot, BBB power up) we can start debugging. First, run the OpenOCD. If you passed the same commands as I did, go to the openocd/install/bin directory and run this command:

$ ./openocd -f interface/jlink.cfg -f board/ti_beaglebone_black.cfg -c init -c "reset init"
Open On-Chip Debugger 0.11.0+dev-00035-g8d6f7c922-dirty (2021-06-01-22:31)
Licensed under GNU GPL v2
For bug reports, read
	http://openocd.org/doc/doxygen/bugs.html
Info : auto-selecting first available session transport "jtag". To override use 'transport select <transport>'.
Info : J-Link V10 compiled Oct  6 2017 16:37:55
Info : Hardware version: 10.10
Info : VTarget = 3.425 V
Info : clock speed 1000 kHz
Info : JTAG tap: am335x.jrc tap/device found: 0x1b94402f (mfg: 0x017 (Texas Instruments), part: 0xb944, ver: 0x1)
Info : JTAG tap: am335x.tap enabled
Info : am335x.cpu: hardware has 6 breakpoints, 2 watchpoints
Info : starting gdb server for am335x.m3 on 3333
Info : Listening on port 3333 for gdb connections
Info : starting gdb server for am335x.cpu on 3334
Info : Listening on port 3334 for gdb connections
Info : JTAG tap: am335x.jrc tap/device found: 0x1b94402f (mfg: 0x017 (Texas Instruments), part: 0xb944, ver: 0x1)
Info : JTAG tap: am335x.tap enabled
Error: Debug regions are unpowered, an unexpected reset might have happened
Error: JTAG-DP STICKY ERROR
Warn : am335x.cpu: ran after reset and before halt ...
Info : am335x.cpu rev 2, partnum c08, arch f, variant 3, implementor 41
Error: MPIDR not in multiprocessor format
target halted in Thumb state due to debug-request, current mode: Supervisor
cpsr: 0x600001b3 pc: 0x0002412a
MMU: disabled, D-Cache: disabled, I-Cache: disabled
Info : Listening on port 6666 for tcl connections
Info : Listening on port 4444 for telnet connections

OpenOCD connects to the JTAG interface on BBB via JLink and opens a port for a gdb connection. Now we have to run arm-linux-gnueabihf-gdb. Open a new terminal window and go to the u-boot directory.

To ease connecting gdb, I prepared a gdbinit script. Please copy it to a file, you will refer to it on debugger start.

# Connect to OpenOCD
target extended-remote :3334

# Create normal breakpoint
b _start

# Restart device and halt it
monitor reset halt
monitor sleep 2000 # we must wait for completion after each command

# Create hardware breakpoint in the starting point of shadowed MLO (check part 1)
monitor bp 0x402f0400 4 hw
monitor sleep 2000

# Restart BBB once again, we will stop on upper breakpoint
monitor reset run
monitor sleep 2000

# We have already stopped, remove this hardware breakpoint
monitor rbp 0x402f0400
# Disable watchdog!
monitor disable_watchdog
monitor sleep 2000

continue

I’m not sure why separate b _start (which is placed on 0x402f0400) and monitor bp 0x402f0400 4 hw is needed. But from many combinations, this one works. I will try to find out why this happens. If you have any idea, please add a comment.

Now we can run the debugger:

$ arm-linux-gnueabihf-gdb spl/u-boot-spl --command=~/Documents/gdbinit-bbb
GNU gdb (Linaro_GDB-2018.05) 8.1.0.20180612-git
Copyright (C) 2018 Free Software Foundation, Inc.
License GPLv3+: GNU GPL version 3 or later <http://gnu.org/licenses/gpl.html>
This is free software: you are free to change and redistribute it.
There is NO WARRANTY, to the extent permitted by law.  Type "show copying"
and "show warranty" for details.
This GDB was configured as "--host=x86_64-unknown-linux-gnu --target=arm-linux-gnueabihf".
Type "show configuration" for configuration details.
For bug reporting instructions, please see:
<http://www.gnu.org/software/gdb/bugs/>.
Find the GDB manual and other documentation resources online at:
<http://www.gnu.org/software/gdb/documentation/>.
For help, type "help".
Type "apropos word" to search for commands related to "word"...
Reading symbols from spl/u-boot-spl...done.
0x00024126 in ?? ()
Breakpoint 1 at 0x402f0400: file arch/arm/lib/vectors.S, line 87.
JTAG tap: am335x.jrc tap/device found: 0x1b94402f (mfg: 0x017 (Texas Instruments), part: 0xb944, ver: 0x1)
JTAG tap: am335x.tap enabled
Debug regions are unpowered, an unexpected reset might have happened
JTAG-DP STICKY ERROR
am335x.cpu: ran after reset and before halt ...
am335x.cpu rev 2, partnum c08, arch f, variant 3, implementor 41
target halted in Thumb state due to debug-request, current mode: Supervisor
cpsr: 0x000001b3 pc: 0x00024136
MMU: disabled, D-Cache: disabled, I-Cache: disabled
jtag_flush_queue_sleep [sleep in ms]
sleep milliseconds ['busy']

breakpoint set at 0x402f0400

JTAG tap: am335x.jrc tap/device found: 0x1b94402f (mfg: 0x017 (Texas Instruments), part: 0xb944, ver: 0x1)
JTAG tap: am335x.tap enabled
Debug regions are unpowered, an unexpected reset might have happened
JTAG-DP STICKY ERROR
am335x.cpu rev 2, partnum c08, arch f, variant 3, implementor 41
target halted in ARM state due to breakpoint, current mode: Supervisor
cpsr: 0x40000193 pc: 0x402f0400
MMU: disabled, D-Cache: disabled, I-Cache: disabled
am335x.cpu rev 2, partnum c08, arch f, variant 3, implementor 41

Breakpoint 1, _start () at arch/arm/lib/vectors.S:87
87		ARM_VECTORS
(gdb)

Voila, we finally are ready to debug the MLO code. We will cover this in the next chapter. I recommend check the configuration with console-based gdb and then configure more interactive IDE like Eclipse or VSCode.